Add initial support for s390 auxiliary traces using the CPU-Measurement
Sampling Facility.

Support and ignore PERF_REPORT_AUXTRACE_INFO records in the perf data
file. Later patches will show the contents of the auxiliary traces.

Setup the auxtrace queues and data structures for s390.  A raw dump of
the perf.data file now does not show an error when an auxtrace event is
encountered.

Output before:

  [root@s35lp76 perf]# ./perf report -D -i perf.data.auxtrace
  0x128 [0x10]: failed to process type: 70
  Error:
  failed to process sample

  0x128 [0x10]: event: 70
  .
  . ... raw event: size 16 bytes
  .  0000:  00 00 00 46 00 00 00 10 00 00 00 00 00 00 00 00  ...F............

  0x128 [0x10]: PERF_RECORD_AUXTRACE_INFO type: 0
  [root@s35lp76 perf]#

Output after:

   # ./perf report -D -i perf.data.auxtrace |fgrep PERF_RECORD_AUXTRACE
  0 0 0x128 [0x10]: PERF_RECORD_AUXTRACE_INFO type: 5
  0 0 0x25a66 [0x30]: PERF_RECORD_AUXTRACE size: 0x40000
	   offset: 0  ref: 0  idx: 4  tid: -1  cpu: 4
  ....

Additional notes about the underlying hardware and software
implementation, provided by Hendrik Brueckner (see Link: below).

=============================================================================

The CPU-Measurement Facility (CPU-MF) provides a set of functions to obtain
performance information on the mainframe.  Basically, it was introduced
with System z10 years ago for the z/Architecture, that means, 64-bit.
For Linux, there are two facilities of interest, counter facility and sampling
facility.  The counter facility provides hardware counters for instructions,
cycles, crypto-activities, and many more.

The sampling facility is a hardware sampler that when started will write
samples at a particular interval into a sampling buffer.  At some point,
for example, if a sample block is full, it generates an interrupt to collect
samples (while the sampler continues to run).

Few years ago, I started to provide the a perf PMU to use the counter
and sampling facilities.  Recently, the device driver was updated to also
"export" the sampling buffer into the AUX area.  Thomas now completed the
related perf work to interpret and process these AUX data.

If people are more interested in the sampling facility, they can have a
look into:

- The Load-Program-Parameter and the CPU-Measurement Facilities, SA23-2260-05
  http://www-01.ibm.com/support/docview.wss?uid=isg26fcd1cc32246f4c8852574ce0044734a

and to learn how-to use it for Linux on Z, have look at chapter 54,
"Using the CPU-measurement facilities" in the:

- Device Drivers, Features, and Commands, SC33-8411-34
  http://public.dhe.ibm.com/software/dw/linux390/docu/l416dd34.pdf

=============================================================================

Signed-off-by: Thomas Richter <[email protected]>
Reviewed-by: Hendrik Brueckner <[email protected]>
Link: http://lkml.kernel.org/r/[email protected]
Cc: Heiko Carstens <[email protected]>
Cc: Martin Schwidefsky <[email protected]>
Link: http://lkml.kernel.org/r/[email protected]
Signed-off-by: Arnaldo Carvalho de Melo <[email protected]>
Adding mem2node object to allow the easy lookup of the node for the
physical address.

It has following interface:

  int  mem2node__init(struct mem2node *map, struct perf_env *env);
  void mem2node__exit(struct mem2node *map);
  int  mem2node__node(struct mem2node *map, u64 addr);

The mem2node__toolsinit initialize object from the perf data file
MEM_TOPOLOGY feature data. Following calls to mem2node__node will return
node number for given physical address. The mem2node__exit function
frees the object.

Signed-off-by: Jiri Olsa <[email protected]>
Cc: Alexander Shishkin <[email protected]>
Cc: David Ahern <[email protected]>
Cc: Namhyung Kim <[email protected]>
Cc: Peter Zijlstra <[email protected]>
Link: http://lkml.kernel.org/r/[email protected]
Signed-off-by: Arnaldo Carvalho de Melo <[email protected]>
Change the Makefile and build process to no longer require audit-libs
interfaces when the architecture provides system call tables.

Committer notes:

Its not enough to hook into the NO_LIBAUDIT makefile block, we need to
define a CONFIG_TRACE that gets selected by both architectures
generating the syscall tables from the kernel headers and from detecting
the availability of libaudit.

With that in place we will not link against libaudit even if the
necessary files are available for that, in fact we will not even try to
detect its availability, speeding up a bit the feature detection phase.

Signed-off-by: Hendrik Brueckner <[email protected]>
Reviewed-by: Thomas Richter <[email protected]>
Tested-by: Arnaldo Carvalho de Melo <[email protected]>
Cc: Jiri Olsa <[email protected]>
Cc: Michael Petlan <[email protected]>
Cc: [email protected]
LPU-Reference: [email protected]
Link: https://lkml.kernel.org/n/[email protected]
Signed-off-by: Arnaldo Carvalho de Melo <[email protected]>
Andi reported a performance drop in single threaded perf tools such as
'perf script' due to the growing number of locks being put in place to
allow for multithreaded tools, so wrap the POSIX threads rwlock routines
with the names used for such kinds of locks in the Linux kernel and then
allow for tools to ask for those locks to be used or not.

I.e. a tool may have a multithreaded phase and then switch to single
threaded, like the upcoming patches for the synthesizing of
PERF_RECORD_{FORK,MMAP,etc} for pre-existing processes to then switch to
single threaded mode in 'perf top'.

The init routines will not be conditional, this way starting as single
threaded to then move to multi threaded mode should be possible.

Reported-by: Andi Kleen <[email protected]>
Cc: Adrian Hunter <[email protected]>
Cc: David Ahern <[email protected]>
Cc: Jiri Olsa <[email protected]>
Cc: Kan Liang <[email protected]>
Cc: Namhyung Kim <[email protected]>
Cc: Peter Zijlstra <[email protected]>
Cc: Wang Nan <[email protected]>
Link: http://lkml.kernel.org/r/[email protected]
Signed-off-by: Arnaldo Carvalho de Melo <[email protected]>
Add generic support for standalone metrics specified in JSON files to
perf stat. A metric is a formula that uses multiple events to compute a
higher level result (e.g. IPC).

Previously metrics were always tied to an event and automatically
enabled with that event. But now change it that we can have standalone
metrics. They are in the same JSON data structure as events, but don't
have an event name.

We also allow to organize the metrics in metric groups, which allows a
short cut to select several related metrics at once.

Add a new -M / --metrics option to perf stat that adds the metrics or
metric groups specified.

Add the core code to manage and parse the metric groups. They are
collected from the JSON data structures into a separate rblist.  When
computing shadow values look for metrics in that list.  Then they are
computed using the existing saved values infrastructure in stat-shadow.c

The actual JSON metrics are in a separate pull request.

  % perf stat -M Summary --metric-only -a sleep 1

   Performance counter stats for 'system wide':

  Instructions   CLKS          CPU_Utilization  GFLOPs   SMT_2T_Utilization   Kernel_Utilization
  317614222.0    1392930775.0  0.0              0.0      0.2                  0.1

       1.001497549 seconds time elapsed

  % perf stat -M GFLOPs flops

   Performance counter stats for 'flops':

     3,999,541,471  fp_comp_ops_exe.sse_scalar_single #  1.2 GFLOPs   (66.65%)
                14  fp_comp_ops_exe.sse_scalar_double                 (66.65%)
                 0  fp_comp_ops_exe.sse_packed_double                 (66.67%)
                 0  fp_comp_ops_exe.sse_packed_single                 (66.70%)
                 0  simd_fp_256.packed_double                         (66.70%)
                 0  simd_fp_256.packed_single                         (66.67%)
                 0  duration_time

       3.238372845 seconds time elapsed

v2: Add missing header file
v3: Move find_map to pmu.c

Signed-off-by: Andi Kleen <[email protected]>
Acked-by: Jiri Olsa <[email protected]>
Link: http://lkml.kernel.org/r/[email protected]
Signed-off-by: Arnaldo Carvalho de Melo <[email protected]>
Create new util/branch.c and util/branch.h to contain the common branch
functions. Such as:

branch_type_count(): Count the numbers of branch types
branch_type_name() : Return the name of branch type
branch_type_stat_display(): Display branch type statistics info
branch_type_str(): Construct the branch type string.

The branch type is saved in branch_flags.

Change log:

v8: Change PERF_BR_NONE to PERF_BR_UNKNOWN.

v7: Since the common branch type name is changed (e.g. JCC->COND),
    this patch is performed the modification accordingly.

v6: Move that multiline conditional code inside {} brackets.
    Move branch_type_stat_display() from builtin-report.c to
      branch.c.
    Move branch_type_str() from callchain.c to branch.c.

v5: It's a new patch in v5 patch series.

Signed-off-by: Yao Jin <[email protected]>
Acked-by: Jiri Olsa <[email protected]>
Cc: Alexander Shishkin <[email protected]>
Cc: Andi Kleen <[email protected]>
Cc: Kan Liang <[email protected]>
Cc: Michael Ellerman <[email protected]>
Cc: Peter Zijlstra <[email protected]>
Link: http://lkml.kernel.org/r/[email protected]
[ Don't use 'index' and 'stat' as names for variables, it shadows global decls in older distros ]
Signed-off-by: Arnaldo Carvalho de Melo <[email protected]>
Add a simple expression parser good enough to parse JSON relation
expressions. The parser is implemented using bison.

This is just intended as an simple parser for internal usage in the
event lists, not the beginning of a "perf scripting language"

v2: Use expr__ prefix instead of expr_
    Support multiple free variables for parser

Committer note:

The v2 patch had:

  %define api.pure full

In expr.y, that is a feature introduced in bison 2.7, to have reentrant
parsers, not using global variables, which would make tools/perf stop
building with the bison version shipped in older distros, so Andi
realised that the other parsers (e.g. parse-events.y) were using:

  %pure-parser

Which is present in older versions of bison and fits the bill.

I added:

  CFLAGS_expr-bison.o += -DYYENABLE_NLS=0 -DYYLTYPE_IS_TRIVIAL=0 -w

To finally make it build, copying what was there for pmu-bison.o,
another parser.

Signed-off-by: Andi Kleen <[email protected]>
Acked-by: Jiri Olsa <[email protected]>
Link: http://lkml.kernel.org/r/[email protected]
[ stdlib.h is needed in tests/expr.c for free() fixing build in systems such as ubuntu:16.04-x-s390 ]
Signed-off-by: Arnaldo Carvalho de Melo <[email protected]>
Implement printing instruction sequences as hex dump for branch stacks.

This relies on the x86 instruction decoder used by the PT decoder to
find the lengths of instructions to dump them individually.

This is good enough for pattern matching.

This allows to study hot paths for individual samples, together with
branch misprediction and cycle count / IPC information if available (on
Skylake systems).

  % perf record -b ...
  % perf script -F brstackinsn
  ...
    read_hpet+67:
          ffffffff9905b843        insn: 74 ea                     # PRED
          ffffffff9905b82f        insn: 85 c9
          ffffffff9905b831        insn: 74 12
          ffffffff9905b833        insn: f3 90
          ffffffff9905b835        insn: 48 8b 0f
          ffffffff9905b838        insn: 48 89 ca
          ffffffff9905b83b        insn: 48 c1 ea 20
          ffffffff9905b83f        insn: 39 f2
          ffffffff9905b841        insn: 89 d0
          ffffffff9905b843        insn: 74 ea                     # PRED

Only works when no special branch filters are specified.

Occasionally the path does not reach up to the sample IP, as the LBRs
may be frozen before executing a final jump. In this case we print a
special message.

The instruction dumper piggy backs on the existing infrastructure from
the IP PT decoder.

An earlier iteration of this patch relied on a disassembler, but this
version only uses the existing instruction decoder.

Committer note:

Added hint about how to get suitable perf.data files for use with
'-F brstackinsm':

  $ perf record usleep 1
  [ perf record: Woken up 1 times to write data ]
  [ perf record: Captured and wrote 0.018 MB perf.data (8 samples) ]
  $
  $ perf script -F brstackinsn
  Display of branch stack assembler requested, but non all-branch filter set
  Hint: run 'perf record -b ...'
  $

Signed-off-by: Andi Kleen <[email protected]>
Tested-by: Arnaldo Carvalho de Melo <[email protected]>
Cc: Jiri Olsa <[email protected]>
Cc: Michael Ellerman <[email protected]>
Link: http://lkml.kernel.org/r/[email protected]
Signed-off-by: Arnaldo Carvalho de Melo <[email protected]>
Introduce a new option to record PERF_RECORD_NAMESPACES events emitted
by the kernel when fork, clone, setns or unshare are invoked. And update
perf-record documentation with the new option to record namespace
events.

Committer notes:

Combined it with a later patch to allow printing it via 'perf report -D'
and be able to test the feature introduced in this patch. Had to move
here also perf_ns__name(), that was introduced in another later patch.

Also used PRIu64 and PRIx64 to fix the build in some enfironments wrt:

  util/event.c:1129:39: error: format '%lx' expects argument of type 'long unsigned int', but argument 6 has type 'long long unsigned int' [-Werror=format=]
     ret  += fprintf(fp, "%u/%s: %lu/0x%lx%s", idx
                                         ^
Testing it:

  # perf record --namespaces -a
  ^C[ perf record: Woken up 1 times to write data ]
  [ perf record: Captured and wrote 1.083 MB perf.data (423 samples) ]
  #
  # perf report -D
  <SNIP>
  3 2028902078892 0x115140 [0xa0]: PERF_RECORD_NAMESPACES 14783/14783 - nr_namespaces: 7
                [0/net: 3/0xf0000081, 1/uts: 3/0xeffffffe, 2/ipc: 3/0xefffffff, 3/pid: 3/0xeffffffc,
                 4/user: 3/0xeffffffd, 5/mnt: 3/0xf0000000, 6/cgroup: 3/0xeffffffb]

  0x1151e0 [0x30]: event: 9
  .
  . ... raw event: size 48 bytes
  .  0000:  09 00 00 00 02 00 30 00 c4 71 82 68 0c 7f 00 00  ......0..q.h....
  .  0010:  a9 39 00 00 a9 39 00 00 94 28 fe 63 d8 01 00 00  .9...9...(.c....
  .  0020:  03 00 00 00 00 00 00 00 ce c4 02 00 00 00 00 00  ................
  <SNIP>
        NAMESPACES events:          1
  <SNIP>
  #

Signed-off-by: Hari Bathini <[email protected]>
Acked-by: Jiri Olsa <[email protected]>
Tested-by: Arnaldo Carvalho de Melo <[email protected]>
Cc: Alexander Shishkin <[email protected]>
Cc: Alexei Starovoitov <[email protected]>
Cc: Ananth N Mavinakayanahalli <[email protected]>
Cc: Aravinda Prasad <[email protected]>
Cc: Brendan Gregg <[email protected]>
Cc: Daniel Borkmann <[email protected]>
Cc: Eric Biederman <[email protected]>
Cc: Peter Zijlstra <[email protected]>
Cc: Sargun Dhillon <[email protected]>
Cc: Steven Rostedt <[email protected]>
Link: http://lkml.kernel.org/r/148891930386.25309.18412039920746995488.stgit@hbathini.in.ibm.com
Signed-off-by: Arnaldo Carvalho de Melo <[email protected]>
The use_browser and perf_version_string variables are both declared in
perf.c but they are also referenced by other functions of libperf.a.

Therefore a user linking an own main() with libperf.a must declare those
two variables in their files even if the files never use the browser or
the version information.

This patch fixes this issue by moving use_browser and
perf_version_string out of perf.c to some other files.

Signed-off-by: Soramichi Akiyama <[email protected]>
Cc: Alexander Shishkin <[email protected]>
Cc: Peter Zijlstra <[email protected]>
Link: http://lkml.kernel.org/r/[email protected]
Signed-off-by: Arnaldo Carvalho de Melo <[email protected]>
Add basic clang support in clang.cpp and test__clang() testcase. The
first testcase checks if builtin clang is able to generate LLVM IR.

tests/clang.c is a proxy. Real testcase resides in
utils/c++/clang-test.cpp in c++ and exports C interface to perf test
subsystem.

Test result:

   $ perf test -v clang
   51: builtin clang support                               :
   51.1: Test builtin clang compile C source to IR              :
   --- start ---
   test child forked, pid 13215
   test child finished with 0
   ---- end ----
   Test builtin clang support subtest 0: Ok

Committer note:

Make sure you've enabled CLANG and LLVM builtin support by setting
the LIBCLANGLLVM variable on the make command line, e.g.:

  make LIBCLANGLLVM=1 O=/tmp/build/perf -C tools/perf install-bin

Otherwise you'll get this when trying to do the 'perf test' call above:

  # perf test clang
  51: builtin clang support                      : Skip (not compiled in)
  #

Signed-off-by: Wang Nan <[email protected]>
Tested-by: Arnaldo Carvalho de Melo <[email protected]>
Cc: Alexei Starovoitov <[email protected]>
Cc: He Kuang <[email protected]>
Cc: Jiri Olsa <[email protected]>
Cc: Joe Stringer <[email protected]>
Cc: Zefan Li <[email protected]>
Cc: [email protected]
Link: http://lkml.kernel.org/r/[email protected]
[ Removed "Test" from descriptions, redundant and already removed from all the other entries ]
Signed-off-by: Arnaldo Carvalho de Melo <[email protected]>
Add function to parse a user time string of the form <start>,<stop>
where start and stop are time in sec.nsec format. Both start and stop
times are optional.

Add function to determine if a sample time is within a given time
time window of interest.

Signed-off-by: David Ahern <[email protected]>
Acked-by: Namhyung Kim <[email protected]>
Cc: Jiri Olsa <[email protected]>
Cc: Peter Zijlstra <[email protected]>
Link: http://lkml.kernel.org/r/[email protected]
Signed-off-by: Arnaldo Carvalho de Melo <[email protected]>
Perf hooks allow hooking user code at perf events. They can be used for
manipulation of BPF maps, taking snapshot and reporting results. In this
patch two perf hook points are introduced: record_start and record_end.

To avoid buggy user actions, a SIGSEGV signal handler is introduced into
'perf record'. It turns off perf hook if it causes a segfault and report
an error to help debugging.

A test case for perf hook is introduced.

Test result:
  $ ./buildperf/perf test -v hook
  50: Test perf hooks                                          :
  --- start ---
  test child forked, pid 10311
  SIGSEGV is observed as expected, try to recover.
  Fatal error (SEGFAULT) in perf hook 'test'
  test child finished with 0
  ---- end ----
  Test perf hooks: Ok

Signed-off-by: Wang Nan <[email protected]>
Cc: Alexei Starovoitov <[email protected]>
Cc: He Kuang <[email protected]>
Cc: Jiri Olsa <[email protected]>
Cc: Joe Stringer <[email protected]>
Cc: Zefan Li <[email protected]>
Cc: [email protected]
Link: http://lkml.kernel.org/r/[email protected]
Signed-off-by: Arnaldo Carvalho de Melo <[email protected]>
This patch modifies the build dependencies on the jitdump support in
perf. As it stands jitdump was wrongfully made dependent 100% on using
DWARF. However, the dwarf dependency, only exist if generating the
source line table in genelf_debug.c. The rest of the support does not
need DWARF.

This patch removes the dependency on DWARF for the entire jitdump
support. It keeps it only for the genelf_debug.c support.

Signed-off-by: Maciej Debski <[email protected]>
Reviewed-by: Stephane Eranian <[email protected]>
Cc: Anton Blanchard <[email protected]>
Cc: Jiri Olsa <[email protected]>
Cc: Namhyung Kim <[email protected]>
Cc: Peter Zijlstra <[email protected]>
Link: http://lkml.kernel.org/r/[email protected]
Fixes: e12b202f8f ("perf jitdump: Build only on supported archs")
[ Make it build only if NO_LIBELF isn't defined, as jitdump.o will only be built in that case ]
Signed-off-by: Arnaldo Carvalho de Melo <[email protected]>
I wanted to know the hottest path through a function and figured the
branch-stack (LBR) information should be able to help out with that.

The below uses the branch-stack to create basic blocks and generate
statistics from them.

        from    to              branch_i
        * ----> *
                |
                | block
                v
                * ----> *
                from    to      branch_i+1

The blocks are broken down into non-overlapping ranges, while tracking
if the start of each range is an entry point and/or the end of a range
is a branch.

Each block iterates all ranges it covers (while splitting where required
to exactly match the block) and increments the 'coverage' count.

For the range including the branch we increment the taken counter, as
well as the pred counter if flags.predicted.

Using these number we can find if an instruction:

 - had coverage; given by:

        br->coverage / br->sym->max_coverage

   This metric ensures each symbol has a 100% spot, which reflects the
   observation that each symbol must have a most covered/hottest
   block.

 - is a branch target: br->is_target && br->start == add

 - for targets, how much of a branch's coverages comes from it:

	target->entry / branch->coverage

 - is a branch: br->is_branch && br->end == addr

 - for branches, how often it was taken:

        br->taken / br->coverage

   after all, all execution that didn't take the branch would have
   incremented the coverage and continued onward to a later branch.

 - for branches, how often it was predicted:

        br->pred / br->taken

The coverage percentage is used to color the address and asm sections;
for low (<1%) coverage we use NORMAL (uncolored), indicating that these
instructions are not 'important'. For high coverage (>75%) we color the
address RED.

For each branch, we add an asm comment after the instruction with
information on how often it was taken and predicted.

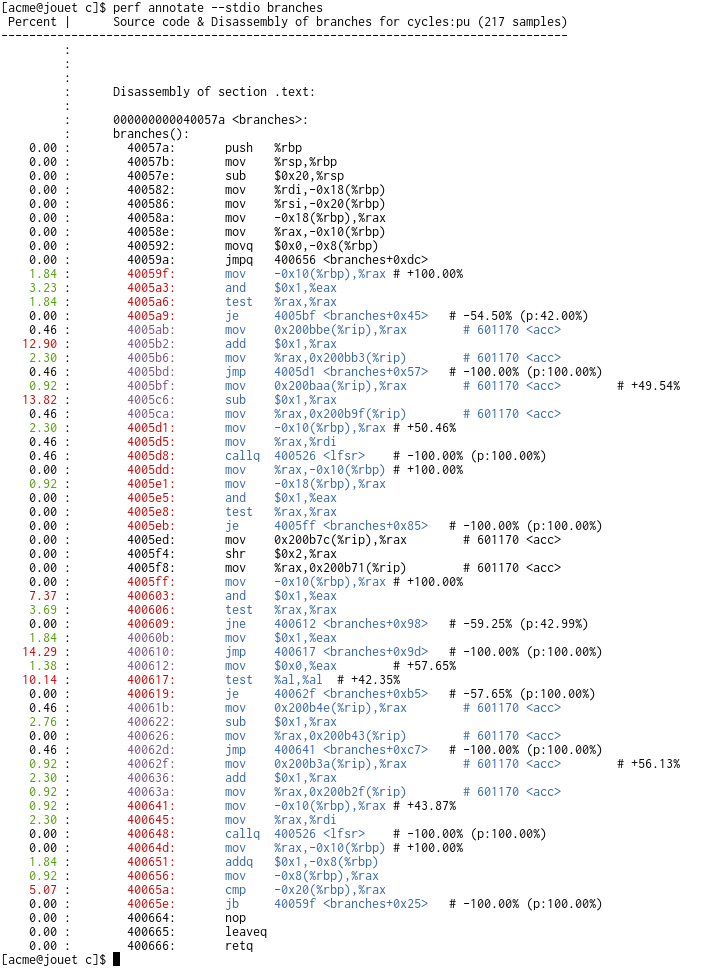
Output looks like (sans color, which does loose a lot of the
information :/)

$ perf record --branch-filter u,any -e cycles:p ./branches 27
$ perf annotate branches

 Percent |	Source code & Disassembly of branches for cycles:pu (217 samples)
---------------------------------------------------------------------------------
         :	branches():
    0.00 :	  40057a:       push   %rbp
    0.00 :	  40057b:       mov    %rsp,%rbp
    0.00 :	  40057e:       sub    $0x20,%rsp
    0.00 :	  400582:       mov    %rdi,-0x18(%rbp)
    0.00 :	  400586:       mov    %rsi,-0x20(%rbp)
    0.00 :	  40058a:       mov    -0x18(%rbp),%rax
    0.00 :	  40058e:       mov    %rax,-0x10(%rbp)
    0.00 :	  400592:       movq   $0x0,-0x8(%rbp)
    0.00 :	  40059a:       jmpq   400656 <branches+0xdc>
    1.84 :	  40059f:       mov    -0x10(%rbp),%rax	# +100.00%
    3.23 :	  4005a3:       and    $0x1,%eax
    1.84 :	  4005a6:       test   %rax,%rax
    0.00 :	  4005a9:       je     4005bf <branches+0x45>	# -54.50% (p:42.00%)
    0.46 :	  4005ab:       mov    0x200bbe(%rip),%rax        # 601170 <acc>
   12.90 :	  4005b2:       add    $0x1,%rax
    2.30 :	  4005b6:       mov    %rax,0x200bb3(%rip)        # 601170 <acc>
    0.46 :	  4005bd:       jmp    4005d1 <branches+0x57>	# -100.00% (p:100.00%)
    0.92 :	  4005bf:       mov    0x200baa(%rip),%rax        # 601170 <acc>	# +49.54%
   13.82 :	  4005c6:       sub    $0x1,%rax
    0.46 :	  4005ca:       mov    %rax,0x200b9f(%rip)        # 601170 <acc>
    2.30 :	  4005d1:       mov    -0x10(%rbp),%rax	# +50.46%
    0.46 :	  4005d5:       mov    %rax,%rdi
    0.46 :	  4005d8:       callq  400526 <lfsr>	# -100.00% (p:100.00%)
    0.00 :	  4005dd:       mov    %rax,-0x10(%rbp)	# +100.00%
    0.92 :	  4005e1:       mov    -0x18(%rbp),%rax
    0.00 :	  4005e5:       and    $0x1,%eax
    0.00 :	  4005e8:       test   %rax,%rax
    0.00 :	  4005eb:       je     4005ff <branches+0x85>	# -100.00% (p:100.00%)
    0.00 :	  4005ed:       mov    0x200b7c(%rip),%rax        # 601170 <acc>
    0.00 :	  4005f4:       shr    $0x2,%rax
    0.00 :	  4005f8:       mov    %rax,0x200b71(%rip)        # 601170 <acc>
    0.00 :	  4005ff:       mov    -0x10(%rbp),%rax	# +100.00%
    7.37 :	  400603:       and    $0x1,%eax
    3.69 :	  400606:       test   %rax,%rax
    0.00 :	  400609:       jne    400612 <branches+0x98>	# -59.25% (p:42.99%)
    1.84 :	  40060b:       mov    $0x1,%eax
   14.29 :	  400610:       jmp    400617 <branches+0x9d>	# -100.00% (p:100.00%)
    1.38 :	  400612:       mov    $0x0,%eax	# +57.65%
   10.14 :	  400617:       test   %al,%al	# +42.35%
    0.00 :	  400619:       je     40062f <branches+0xb5>	# -57.65% (p:100.00%)
    0.46 :	  40061b:       mov    0x200b4e(%rip),%rax        # 601170 <acc>
    2.76 :	  400622:       sub    $0x1,%rax
    0.00 :	  400626:       mov    %rax,0x200b43(%rip)        # 601170 <acc>
    0.46 :	  40062d:       jmp    400641 <branches+0xc7>	# -100.00% (p:100.00%)
    0.92 :	  40062f:       mov    0x200b3a(%rip),%rax        # 601170 <acc>	# +56.13%
    2.30 :	  400636:       add    $0x1,%rax
    0.92 :	  40063a:       mov    %rax,0x200b2f(%rip)        # 601170 <acc>
    0.92 :	  400641:       mov    -0x10(%rbp),%rax	# +43.87%
    2.30 :	  400645:       mov    %rax,%rdi
    0.00 :	  400648:       callq  400526 <lfsr>	# -100.00% (p:100.00%)
    0.00 :	  40064d:       mov    %rax,-0x10(%rbp)	# +100.00%
    1.84 :	  400651:       addq   $0x1,-0x8(%rbp)
    0.92 :	  400656:       mov    -0x8(%rbp),%rax
    5.07 :	  40065a:       cmp    -0x20(%rbp),%rax
    0.00 :	  40065e:       jb     40059f <branches+0x25>	# -100.00% (p:100.00%)
    0.00 :	  400664:       nop
    0.00 :	  400665:       leaveq
    0.00 :	  400666:       retq

(Note: the --branch-filter u,any was used to avoid spurious target and
branch points due to interrupts/faults, they show up as very small -/+
annotations on 'weird' locations)

Committer note:

Please take a look at:

  http://vger.kernel.org/~acme/perf/annotate_basic_blocks.png

To see the colors.

Signed-off-by: Peter Zijlstra (Intel) <[email protected]>
Tested-by: Arnaldo Carvalho de Melo <[email protected]>
Cc: Alexander Shishkin <[email protected]>
Cc: Andi Kleen <[email protected]>
Cc: Anshuman Khandual <[email protected]>
Cc: David Carrillo-Cisneros <[email protected]>
Cc: Jiri Olsa <[email protected]>
Cc: Kan Liang <[email protected]>
Cc: Linus Torvalds <[email protected]>
Cc: Namhyung Kim <[email protected]>
Cc: Stephane Eranian <[email protected]>
[ Moved sym->max_coverage to 'struct annotate', aka symbol__annotate(sym) ]
Signed-off-by: Arnaldo Carvalho de Melo <[email protected]>
Support probing on offline cross-architecture binary by adding getting
the target machine arch from ELF and choose correct register string for
the machine.

Here is an example:
  -----
  $ perf probe --vmlinux=./vmlinux-arm --definition 'do_sys_open $params'
  p:probe/do_sys_open do_sys_open+0 dfd=%r5:s32 filename=%r1:u32 flags=%r6:s32 mode=%r3:u16
  -----

Here, we can get probe/do_sys_open from above and append it to to the target
machine's tracing/kprobe_events file in the tracefs mountput, usually
/sys/kernel/debug/tracing/kprobe_events (or /sys/kernel/tracing/kprobe_events).

Signed-off-by: Masami Hiramatsu <[email protected]>
Cc: Jiri Olsa <[email protected]>
Cc: Peter Zijlstra <[email protected]>
Link: http://lkml.kernel.org/r/147214229717.23638.6440579792548044658.stgit@devbox
[ Add definition for EM_AARCH64 to fix the build on at least centos 6, debian 7 & ubuntu 12.04.5 ]
Signed-off-by: Arnaldo Carvalho de Melo <[email protected]>
The tools so far have been using the strerror_r() GNU variant, that
returns a string, be it the buffer passed or something else.

But that, besides being tricky in cases where we expect that the
function using strerror_r() returns the error formatted in a provided
buffer (we have to check if it returned something else and copy that
instead), breaks the build on systems not using glibc, like Alpine
Linux, where musl libc is used.

So, introduce yet another wrapper, str_error_r(), that has the GNU
interface, but uses the portable XSI variant of strerror_r(), so that
users rest asured that the provided buffer is used and it is what is
returned.

Cc: Adrian Hunter <[email protected]>
Cc: David Ahern <[email protected]>
Cc: Jiri Olsa <[email protected]>
Cc: Namhyung Kim <[email protected]>
Cc: Wang Nan <[email protected]>
Link: http://lkml.kernel.org/n/[email protected]
Signed-off-by: Arnaldo Carvalho de Melo <[email protected]>
Move the call path handling code out of thread-stack.c and
thread-stack.h to allow other components that are not part of
thread-stack to create call paths.

Summary:

- Create call-path.c and call-path.h and add them to the build.

- Move all call path related code out of thread-stack.c and thread-stack.h
  and into call-path.c and call-path.h.

- A small subset of structures and functions are now visible through
  call-path.h, which is required for thread-stack.c to continue to
  compile.

This change is a prerequisite for subsequent patches in this change set
and by itself contains no user-visible changes.

Signed-off-by: Chris Phlipot <[email protected]>
Acked-by: Adrian Hunter <[email protected]>
Cc: Jiri Olsa <[email protected]>
Cc: Peter Zijlstra <[email protected]>
Link: http://lkml.kernel.org/r/[email protected]
Signed-off-by: Arnaldo Carvalho de Melo <[email protected]>
We used libaudit to map ids to syscall names and vice-versa, but that
imposes a delay in supporting new syscalls, having to wait for libaudit
to get those new syscalls on its tables.

To remove that delay, for x86_64 initially, grab a copy of
arch/x86/entry/syscalls/syscall_64.tbl and use it to generate those
tables.

Syscalls currently not available in audit-libs:

  # trace -e copy_file_range,membarrier,mlock2,pread64,pwrite64,timerfd_create,userfaultfd
  Error:	Invalid syscall copy_file_range, membarrier, mlock2, pread64, pwrite64, timerfd_create, userfaultfd
  Hint:	try 'perf list syscalls:sys_enter_*'
  Hint:	and: 'man syscalls'
  #

With this patch:

  # trace -e copy_file_range,membarrier,mlock2,pread64,pwrite64,timerfd_create,userfaultfd
    8505.733 ( 0.010 ms): gnome-shell/2519 timerfd_create(flags: 524288) = 36
    8506.688 ( 0.005 ms): gnome-shell/2519 timerfd_create(flags: 524288) = 40
   30023.097 ( 0.025 ms): qemu-system-x8/24629 pwrite64(fd: 18, buf: 0x7f63ae382000, count: 4096, pos: 529592320) = 4096
   31268.712 ( 0.028 ms): qemu-system-x8/24629 pwrite64(fd: 18, buf: 0x7f63afd8b000, count: 4096, pos: 2314133504) = 4096
   31268.854 ( 0.016 ms): qemu-system-x8/24629 pwrite64(fd: 18, buf: 0x7f63afda2000, count: 4096, pos: 2314137600) = 4096

Cc: Adrian Hunter <[email protected]>
Cc: David Ahern <[email protected]>
Cc: Jiri Olsa <[email protected]>
Cc: Namhyung Kim <[email protected]>
Cc: Wang Nan <[email protected]>
Link: http://lkml.kernel.org/n/[email protected]
[ Added make dep for 'prepare' in 'LIBPERF_IN', fix by Wang Nan to fix parallell build ]
Signed-off-by: Arnaldo Carvalho de Melo <[email protected]>
We're using libaudit for doing name to id and id to syscall name
translations, but that makes 'perf trace' to have to wait for newer
libaudit versions supporting recently added syscalls, such as
"userfaultfd" at the time of this changeset.

We have all the information right there, in the kernel sources, so move
this code to a separate place, wrapped behind functions that will
progressively use the kernel source files to extract the syscall table
for use in 'perf trace'.

Cc: Adrian Hunter <[email protected]>
Cc: David Ahern <[email protected]>
Cc: Jiri Olsa <[email protected]>
Cc: Namhyung Kim <[email protected]>
Cc: Wang Nan <[email protected]>
Link: http://lkml.kernel.org/n/[email protected]
Signed-off-by: Arnaldo Carvalho de Melo <[email protected]>
While building on a Docker container for ubuntu and installing package
by package one ends up with:

    MKDIR    /tmp/build/util/
    CC       /tmp/build/util/genelf.o
  util/genelf.c:22:19: fatal error: dwarf.h: No such file or directory
   #include <dwarf.h>
                   ^
  compilation terminated.
  mv: cannot stat '/tmp/build/util/.genelf.o.tmp': No such file or directory

Because the jitdump code needs the DWARF related development packages to
be installed. So make it dependent on that so that the build can succeed
without jitdump support.

Cc: Adrian Hunter <[email protected]>
Cc: Stephane Eranian <[email protected]>
Cc: Jiri Olsa <[email protected]>
Cc: Namhyung Kim <[email protected]>
Cc: Wang Nan <[email protected]>
Link: http://lkml.kernel.org/n/[email protected]
Signed-off-by: Arnaldo Carvalho de Melo <[email protected]>
This patch adds source line information support to perf for jitted code.

The source line info must be emitted by the runtime, such as JVMTI.

Perf injects extract the source line info from the jitdump file and adds
the corresponding .debug_lines section in the ELF image generated for
each jitted function.

The source line enables matching any address in the profile with a
source file and line number.

The improvement is visible in perf annotate with the source code
displayed alongside the assembly code.

The dwarf code leverages the support from OProfile which is also
released under GPLv2.  Copyright 2007 OProfile authors.

Signed-off-by: Stephane Eranian <[email protected]>
Cc: Adrian Hunter <[email protected]>
Cc: Andi Kleen <[email protected]>
Cc: Carl Love <[email protected]>
Cc: David Ahern <[email protected]>
Cc: Jiri Olsa <[email protected]>
Cc: John McCutchan <[email protected]>
Cc: Namhyung Kim <[email protected]>
Cc: Pawel Moll <[email protected]>
Cc: Peter Zijlstra <[email protected]>
Cc: Sonny Rao <[email protected]>
Cc: Sukadev Bhattiprolu <[email protected]>
Link: http://lkml.kernel.org/r/[email protected]
Signed-off-by: Arnaldo Carvalho de Melo <[email protected]>
 Thomas Richter